Nitrogen Poisoning
Synthesis
Introducing hetero atoms to Single-Wall Carbon Nanotubes should lead to lattice defects and a largely modified outer surface. There have also been reports on the adsorption of molecular nitrogen to the inside of carbon nanotubes during synthesis. Investigating the adsorption on such systems could shed light on the properties of these nanotubes. The material was fabricated using low-pressure CCVD and analyzed in solution and as suspended nanotubes.
The obtained results confirm the presence of heteroatoms and exciton trap states in the synthesized SWNTs but also show the limits for the applied optical analysis techniques.
NCNT (Nitrogen-doped Carbon Nanotubes) have been reported first in 1993 by Yi et al. [105] followed by more detailed investigations and review[106][107]. Ciricmarjanovic gives a thorough introduction on preparation techniques, varying structure, and possible applications.[107] It should be mentioned that the functionalization of nanotubes with carboxylic groups and subsequent amidization is also called N-CNT [108] but this is not subject to this study.
NCNT can be synthesized from a wide range of organic Nitrogen-containing molecules like melanin [109][110][111], benzylamine [112][113][114], phthalocyanine [115] as well as pure acetonitrile [116]. Extending the well-established alcohol catalytic chemical vapor deposition (ACCVD), a combination of acetonitrile and ethanol was chosen in this study following the route for low-pressure CCVD described by Ayala et al.[117]. Ibrahim et al. also reported a similar route for high-pressure CCVD[118] which was adapted for synthesis between 750℃ and 850℃ at 12mbar using either bimetallic Rh-Co catalysts [74] on silicon substrate or Fe-Co catalysts on zeolite [2] as the process is considered to be independent of the substrate[5].
Diameter Reduction
The most prominent observation when synthesizing NCNT via the acetonitrile ACCVD route is the severe diameter change. Adding acetonitrile reduces the amount of larger diameter chiralities and even enhances the growth of smaller diameters.

Acetonitrile in the carbon precursor of the ACCVD process reduces the amount of larger diameters significantly in the sample composition reducing the diameter distribution. The absorption for the NCNT samples is offset to match up at the (6,5) type to emphasize this effect.
The change is first visible when adding concentrations of 1vol.% acetonitrile to the ethanol precursor and gets more prominent when increasing the concentration to 5% up unto 12.5%. It is notable that at lower temperatures, the effect is more prominent even at low fractions of nitrogen in the precursor. A general explanation for this effect is that a nitrogen poisoning of the catalyst causes the observed diameter reduction.[5][119] This is similar to reports on a chirality dependence when mixing Nitrogen-containing molecules to the carbon feedstock.[118][109][110][110]
In addition to the diameter change, the amount of amorphous carbon (measured by the optical density of the samples at 450nm) is significantly reduced, leaving nearly transparent solutions while the typical ACCVD product is black due to the high absorption when dissolved in aqueous 1wt.% Deoxycholate (DOC). A similar decrease is visible when mixing triphenylborane to a toluene carbon source.
Energy-dispersive X-ray spectroscopy (EDX) was carried out to determine the elemental composition of the material. The analysis of the unprocessed raw material shows a direct correlation between the amount of nitrogen in the feedstock and the EDX signal of the raw material at 0.39keV originating from Nitrogen. The elemental composition also shows carbon from the precursor and oxygen from the zeolite catalyst. Approximately 8% of Nitrogen from the source is found again in the obtained CCVD material. Ibrahim et al. also find such near-linear relationship between nitrogen from the precursor and its incorporation in the carbonaceous material.[118]

A fraction of 0.6% of the initial nitrogen from the carbon source is found again in the raw material. The nitrogen content is only significantly detectable for higher nitrogen ratios.
Graphitic Nitrogen
NCNT can be both p and n-type semiconductors. [120][106] The two contradictory properties originate from two different bonding environments of Nitrogen in sp²-carbon-networks: C=N-C and C-N(-C)-C. X-ray photoelectron spectroscopy (XPS) typically proves the incorporation of nitrogen into carbon nanotubes by analyzing the carbon bonding environment. Graphite-like Nitrogen bonds to three carbon atoms while the pyridinic form has only two adjacent carbon neighbors.

In solid-state systems from sp² hybridized carbon, Nitrogen can be built into the carbon lattice as either graphenic or pyridinic nitrogen, respectively leading to p- or n-doped states or to combinations.
During synthesis with high pressure, graphitic Nitrogen is starting to appear between 30vol.% and 60vol.% acetonitrile in the ethanol carbon source while pyridinic Nitrogen is increasing proportionally to the total amount of nitrogen [118]. At low-pressure synthesis, a significantly higher amount of nitrogen is incorporated even at 1 vol.% acetonitrile. Graphitic nitrogen was shown to be already present at these low concentrations and is overall five times higher than pyridinic nitrogen. [5]
As stated by Krstic et al. [120], only graphitic nitrogen bonding environments generate charges in SWNT and can yield real n-type semiconductors. As the bonding environment in NCNT is known to change in acetonitrile nanotubes, electrochemical gate doping was carried out to investigate changes to the bandgap. In combination with absorption measurements, it is possible to observe the filling of the bandgap with charge carriers by observing the reduced generation of E₁₁ excitons [121][122] caused by the Pauli exclusion principle.

Gate-doping of the (7,5) type in an NCNT sample aligned to the trion emission. Measurement by J. Heitmüller [123] on ITO films against a Pt electrode.
The electrochemical measurements were performed using PFO dispersed SWNT films on ITO substrate.[123] PFO was chosen as a surfactant to narrow the diameter distribution of the poly-chiral ACCVD sample to the (7,5) type [7] and avoid energy transfer to chiralities with larger band gaps [124] like the (6,5) type. All potentials were aligned to their mid gap for visibility, and the fitted optical density was normalized to the maximum between 0.5 and 1.5V. Peaks were fitted to Gaussians. The fit of the trion peak was constrained between 1215-1250nm because of overlaps with lower bandgap chiralities, and the E₁₁ absorption was allowed to be fitted between 1020-1075nm. Band gaps were calculated using the simple method described by Tanaka et al. [125] extracting the potential at the point where the optical density is half-depleted utilizing the turning point of the hill equation.
bandgap |
red |
ox |
|
|---|---|---|---|
CoMoCat |
1.79V |
-1.51V |
0.28V |
ACCVD |
1.66V |
-1.34V |
0.32V |
1 vol.% |
1.62V |
-1.19V |
0.44V |
5 vol.% |
1.77V |
-1.58V |
0.19V |
25 vol.% |
1.57V |
-1.43V |
0.14V |
Note
Lower band gaps for the (7,5) type are typically found if the photoluminescence is measured against Ag/AgCl.
setup |
method |
electrode |
ref |
red [V] |
ox [V] |
gap |
(7, 5) |
PL |
Ag/AgCl |
3.97 |
4.98 |
1.01 |
|
bulk |
PL |
Ag/AgCl |
-0.47 |
0.54 |
1.01 |
|
individualized |
PL |
Ag/AgCl |
-0.38 |
0.41 |
0.79 |
These measurements were performed in chloroform on ITO, which is most probably responsible for the significant difference (350meV) in the potential to 1.43eV previously found for the bandgap of the (7,5) type [128].
Part of this significant difference must be due to the calculation with the Tanaka method, which overestimates potentials with different steepness in the intensity signal decay. Another factor is the variation of the dielectric surrounding by using another solvent.
It is noteworthy that the bandgap of the (7,5) type from the ACCVD raw material is 140meV smaller than what was found for the CoMoCat sample and has a much steeper signal decay at the reduction and oxidation sites which is why the ACCVD sample was chosen as a reference. The exponential phase factor nF/RT of the Nernst equation is responsible for the steepness. Therefore, it is possible to explain the steeper decrease in the ACCVD material with a higher electron diffusion due to the increased sample quality. Better Sample quality also reduces the number of defective states that would otherwise broaden the density of states for the excitonic transition. A lower amount of defective states, therefore, also explains the narrower bandgap in the CVD raw material. Nevertheless, this high discrepancy for the undoped (7,5) is unexpected and hinders giving a good interpretation of other results from this measurement.
The measurements at higher acetonitrile additons show an incomplete reduction, which is visible from the missing trion band at negative potentials. It is possible that in NCNT no charged excitons are generated as negative charges can bind to the graphitic nitrogen sites. However, due to the low spectral quality at negative potentials, these findings should not be considered strict.
The interesting finding from this experiment is that upon doping with nitrogen, the bandgap decreases by about 90meV. This decrease is attributed to the introduction of graphitic nitrogen forming charge acceptors in the bandgap.
Lattice Defects
The introduction of graphitic nitrogen to the sp2 hybridized carbon lattice is likely to form defect states. The method of choice for investigating defects in carbon nanotubes is Raman spectroscopy.
A small insignificant red-shift of the graphenic High Energy Mode (HEM, G-mode) for excitation with 488nm and 1064nm is visible. Increasing the nitrogen content of the feedstock also leads to a decrease in the intensity of HEM, which is nearly proportional to the decrease in optical density of the involved nanotubes. The D/G ratio was found to increase when exciting with 570nm, which is in agreement with literature.[118][129][130] However, this increase was barely visible in our samples and only at high acetonitrile concentrations where barely any carbon nanotubes are synthesized.
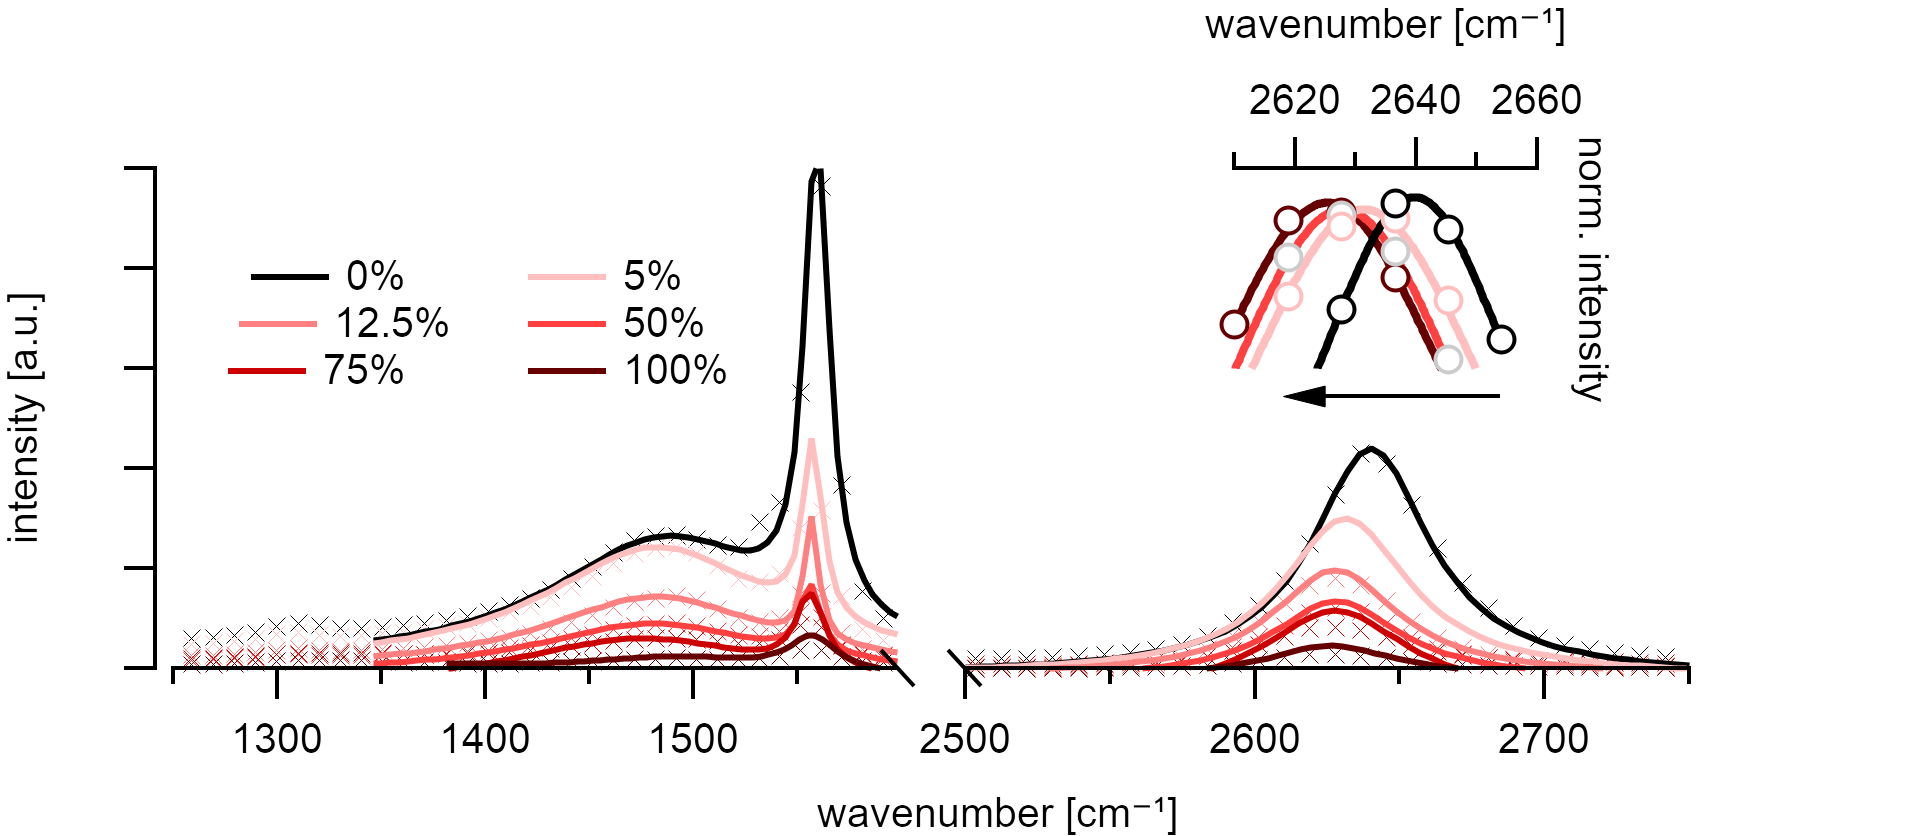
Broadening and frequency shift of the Raman 2D mode (~2640cm⁻¹) of in NCNT in the unpurified samples. No energy changes in the graphenic high energy (HEM) mode (~1560cm⁻¹). Excitation at 488nm.
The D* mode shifts around 15cm⁻¹ to the red. This shift is significant but lower than what is discussed in the literature [5] for this laser wavelength.
Thurakitseree et al. [5] discussed the change in chirality distribution as the origin for these shifts since the mode frequencies of Raman vibrations in carbon nanotubes are known to shift proportional to their inverse diameter[131]. A separation via density gradient ultracentrifugation (DGU) confirmed that there are no differences in the Raman spectra of purified (6,5) NCNT when compared to the ACCVD nanotubes.
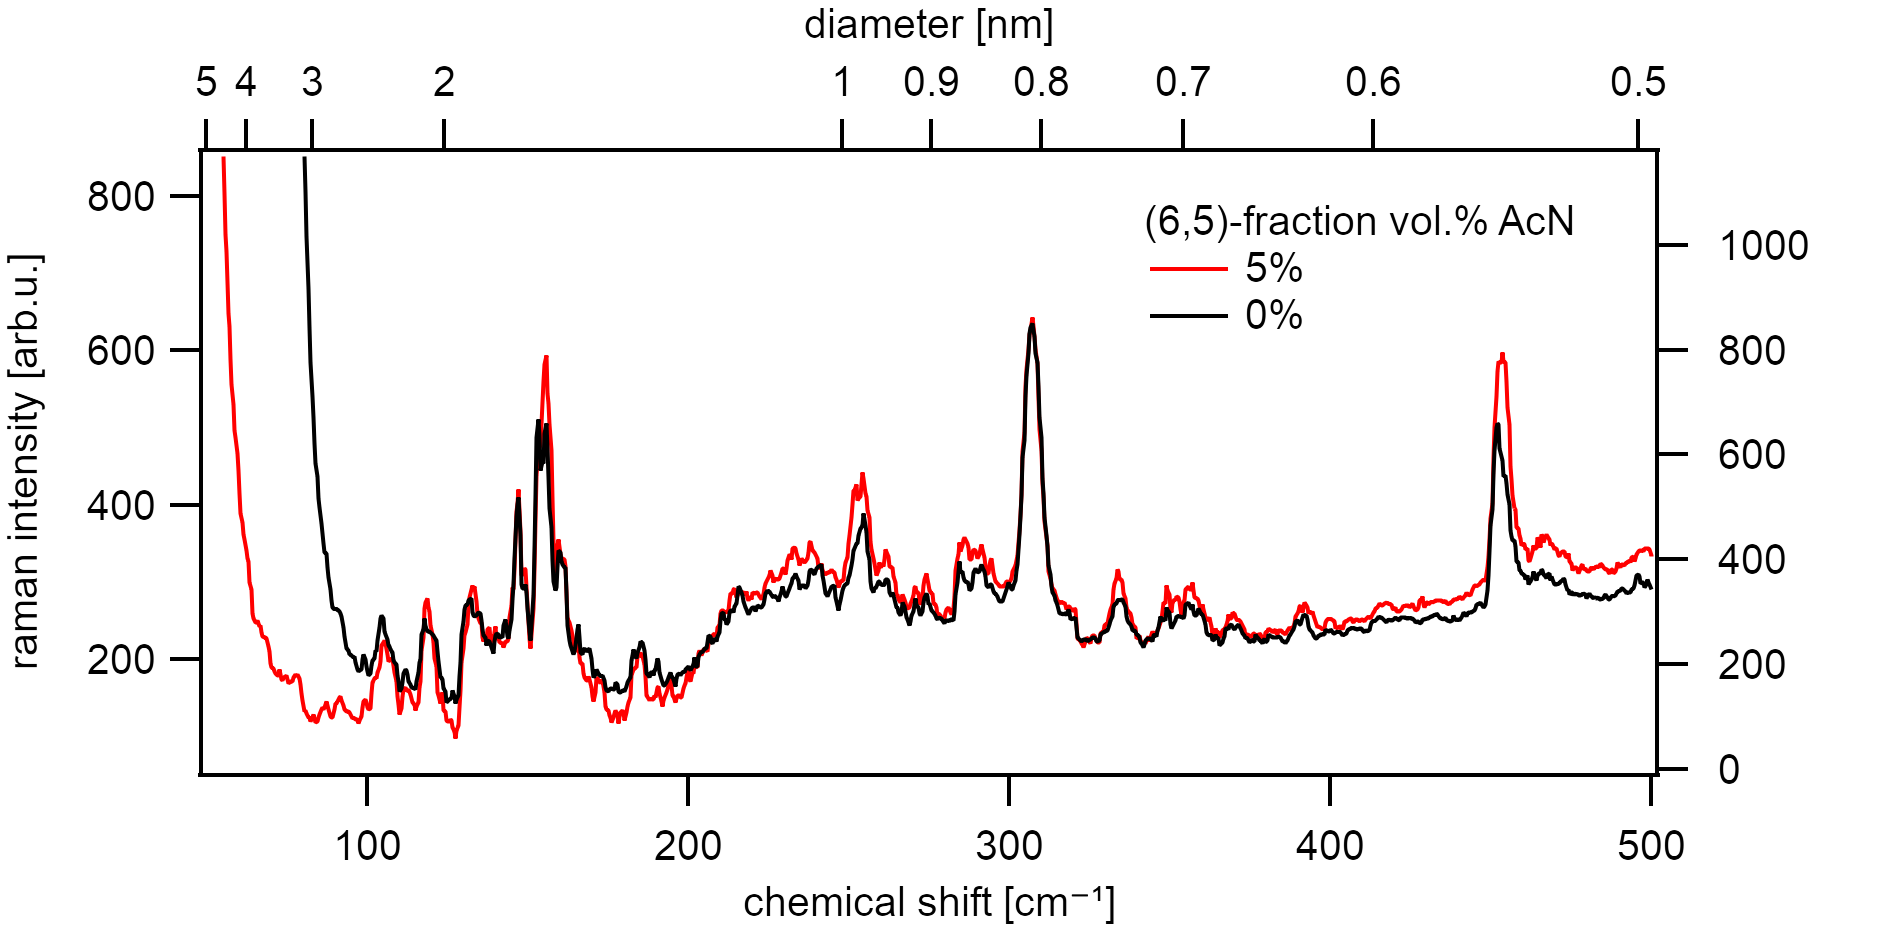
No changes to the RBM mode and fingerprint region of the Raman active vibrations upon low (5vol.%) acetonitrile addition to the ethanol carbon source. Resonant excitation of the (6,5) type (⌀=0.76nm) at 570nm.
However, the photoluminescence quantum yield should be influenced as predicted by the model of diffusion-limited contact quenching [132]. The samples were separated by chirality using a linear density gradient ultracentrifugation [102][103] to identify these changes.
A continuous shift of 6nm to the blue is visible along the density gradient for NCNT samples between the top and bottom fractions. This shift is overly dominant for the NCNT samples. A shift of 4nm with similar changes to the FWHM is typically allocated to the right and left-handed chiral species of the same (n,m) index.[133]

Purified samples of the (6,5) type do not show a significant difference in their excitonic energy but also show a decrease in quantum efficiency
In the NCNT samples, the quantum efficiency of the measured nanotubes is reduced by 25-50% when compared to equally prepared ACCVD samples. These remarkable changes in quantum efficiency can be attributed to the nitrogen doping, which introduces exciton trap states. Notably, the carbon lattice seems to be intact for this type of NCNT judging from the results of Raman spectroscopy on the purified samples.
Molecular Nitrogen
As stated by Ayala et al.[117], it has been proven that molecular nitrogen is either intercalated [115][134] between the bamboo-like multi-wall structure or directly encapsulated [135][114] to the inside of NCNT. It is, however, doubtful if molecular nitrogen inside a single-wall carbon nanotube is preserved during sonication because it was found that nanotubes that are open at the tips do not contain nitrogen.[114]
As some nanotubes grow with closed caps on both ends, it should be possible to preserve the encapsulated Nitrogen if they are investigated as suspended carbon nanotubes. The encapsulated Nitrogen should be responsible for a change of the internal dielectric environment if the encapsulation would be to the inner nanotubes. An analysis of a set of more than 300 Nanotubes synthesized with the ethanol and ethanol/acetonitrile route could not reveal significant statistical deviations from the natural spread of the excitonic energy in air-suspended carbon nanotubes. This result suggests that nitrogen adsorbs to the outside of the carbon nanotube surface during synthesis, and upon forming the bamboo-like structure, it gets encapsulated between the inner walls of the multi-wall carbon nanotubes. Single-wall carbon nanotubes, on the other hand, are not influenced by this process.
Conclusion
Nitrogen is responsible for a significant diameter reduction of the chiral distribution even at low additions of 5vol.% acetonitrile to the ethanol carbon source. The diameter reduction comes at the cost of a loss in photoluminescence quantum yield. Measurements in purified nanotube samples of the low-doped material could not determine changes to the graphenic lattice vibrations. Despite the many reports on molecular nitrogen adsorbed to the inner surface of NCNT, no significant changes of the excitonic energy could be observed, which leaves doubts regarding the adsorption of molecular nitrogen in single-wall carbon nanotubes. Electrochemical measurements have only shown n-type doping by graphitic nitrogen at highest concentrations of acetonitrile. The acetonitrile, when applied in low concentrations, is therefore thought to only poisen the catalyst which shifts the diameter distribution to nanotubes with smaller diameters during synthesis. These nanotubes along with others synthesized from ethanol were statistically investigated and compared in more detail as suspended carbon nanotubes. Nanotubes with smaller diameters show a higher influences to changes in their dielectric environment than nanotubes with larger diameters. These nanotubes can also be investigated in higher digital detail with a silicon camera. The advantage of having a vast amount of spectra available in this range gives better insight into the adsorption processes on their surface that is not so heavily investigated for suspended nanotubes and complement some of the previous investigations in this topic.