Adsorption of Liquid
The influence of solvents on carbon nanotube is the most substantial process during the study of carbon nanotubes. Dispersing nanotubes in a solvent allows various wet processing techniques that are necessary for the integration into devices. The dielectric environment of the used solvent plays a significant role as it directly adsorbs on the outer surface of the nanotube. However, solvent influences are often not distinguishable from the natural effect of the wrapped surfactant. Besides, insufficient de-bundling can intercalate solvent molecules between nanotube bundles [202], which makes simple investigations on this topic nearly impossible. In this experiment, air-suspended carbon nanotubes were placed into different solvents to study the effect of the dielectric environment.
Carbon nanotubes suspended over trenches provide an excellent system for such an investigation. However, the transfer to a solvent typically destroys around 95% of the suspended nanotubes, which is believed to originate from the high capillary forces at the trench sites. The system is, therefore, not ideal for such an investigation. More recently, surface-attached nanotubes were shown to exhibit an extremely narrow linewidth of 0.2meV at cryogenic temperatures [203]. Due to their mechanical stability, nanotubes that are directly attached to a surface seem to be a sound setup for the investigation of solvent effects. However, interactions with such nanotubes are always accompanied by surface effects, and the line widths enormously broaden to around 50meV for individualized nanotubes at room temperature [204] and an investigation in solvent inherently inhibits cryogenic cooling. For best results at room temperature and best comparability to solution-processed nanotubes, thus, air-suspended nanotubes were chosen in this study and placed into three different solvents with varying dielectric constants: hexane (1.89), toluene (2.38), and acetonitrile (37.5) [205]
Such an investigation was previously performed by Miyauchi et al. using a broad laser spot for the illumination of a large sample area [159]. Such an experiment gives a good statistical overview of the process. However, since all nanotubes inhomogeneously differ in their emission energy by different effects like varying water coverage in air or different defect concentrations, the effects on the energy, intensity and line width are impossible to differentiate. A comparison of the emission from the same nanotube before and after the transfer to a solvent will give more accurate insights. The technique for scanning a broad set of suspended carbon nanotubes [136] is crucial for detecting the remaining 5% of nanotubes that survive the wetting process. For the first approximation of solvent adsorption effects, spectra before and after the transfer to solvents were recorded. Other than with the measurement technique by Miyauchi et al., it is possible to exclude unresponsive nanotubes from further investigations. It is assumed that the strong capillary forces destroy most nanotubes at the trenches. The measurement then allows giving the solvation effect for a single nanotube with a still detectable spectral intensity.

The intensity drop at the transfer to the solvent was found to be the lowest in toluene compared to acetonitrile and hexane. Diamond symbols show the median of the set while circled dots depict the distribution of individual measurements.
It can be shown that the transfer to hexane decreases the photoluminescence intensity to 0.0002% of its initial intensity in air. Such a high value is somewhat reasonable as the aliphatic side chains were shown to play a major role for polymer-dispersions and were suspected of wrapping around nanotubes efficiently.[206] An efficient wrapping process also means that a higher surface of the nanotube is covered with the aliphatic chains which form exciton traps for non-radiative decay processes. Therefore, such a wrapping process could be responsible for the substantial luminescence decrease in hexane. The decrease in exciton lifetime was found by Ohno et al. [207] who measured the fs-time correlation signal and found that it decreases from 293ps in air to 5.1ps in hexane. The intensity in acetonitrile only drops to 1.7%, while toluene shows the best results with a decrease to only 12% of the initial emission in air. Such high values for toluene are in agreement with the excellent emission properties of polymer-based nanotube solutions.

The peak shift of the excitonic emission energy E₁₁ is shown for three different organic solvents with two estimated distribution medians as a dashed line. A chiral assignment cannot be performed for this series.
The energy of the observed nanotubes shows shifts of around 40-120meV to the red. In the effective medium approximation [208], the exciton binding energy strongly depends on the Coulomb energy, which in turn is modified by the dielectric function ε. The energy of an electron-hole pair with effective mass μ is thus given by the Hamiltonian
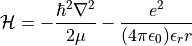
If the dielectric environment is increased, the Coulomb energy of the particle separation is lowered. This mechanism should lead to a blue shift of the excitonic transition energy. However, it was shown that the free carrier continuum described by the Sommerfeld term [209] is also lowered but with a much stronger dependence on the dielectricum. This splitting is the reason for the redshift of the optical transition energy. Ohno et al. found that the shifts saturate at around ε=4 [207]. Hexane (ε=1.9) should, therefore, show lower shifts than acetonitrile (ε=38). However, this difference was reported to be minimal (1-10meV) [207]. In my measurements, the shifts were almost arbitrarily distributed among all solvents and did not show a significant dependence on the strength of the dielectric environment. The preparation of clean surfaces prior to the investigation in a solvent is thus crucial. Although the observed shifts suggest a saturation even for solvents like hexane leading to unresolvable differences, the shifts compared to air-suspended nanotubes are rather high, and they seem to accumulate at around 40meV and 75meV for all solvents. However, the silicon detector’s quantum efficiency hinders a successful investigation for most of the smaller diameter nanotubes.

The Coulomb energy depends on the dielectric medium, and Coulomb forces are responsible for the quantum mechanical exciton binding strength.
The obtained results could help to clarify the discussion [7] on various solvent effects during polymer dispersion of nanotubes. It is expected that the binding of solvent molecules to the surface has a stronger influence than the binding of polymers. The differences in dipole polarizability in the tested solvents also supports other findings for the binding to semiconducting and metallic species [210][211], but further investigations have to be carried out to more substantially make assumptions on the various effects of the solvent during polymer dispersion.
The measured energy shifts show strong disagreement with previously reported shifts [159][207] of 20-40meV. Without making assumptions about the system, a spectra-based analysis is not enough to fully resolve chirality dependent differences. To shed light on the strong discrepancy between this investigation and the literature, as well as the interesting emission properties in toluene, a more detailed investigation was performed using photoluminescence excitation-emission (PLE) spectroscopy.
Adsorption of Toluene
In this section, carbon nanotubes with purely toluene adsorbed on their surface are analyzed in more detail. Toluene is an essential solvent for dispersing nanotubes with polyfluorene based (co-) polymers with high chiral selectivity, and its influence is under ongoing discussion [7].
Usually mechanical forces are used to separate nanotube bundles and surfactants are used to prevent re-bundling. The following analysis focuses on the line width and energy difference between pristine and toluene-wrapped nanotubes on clean surfaces.
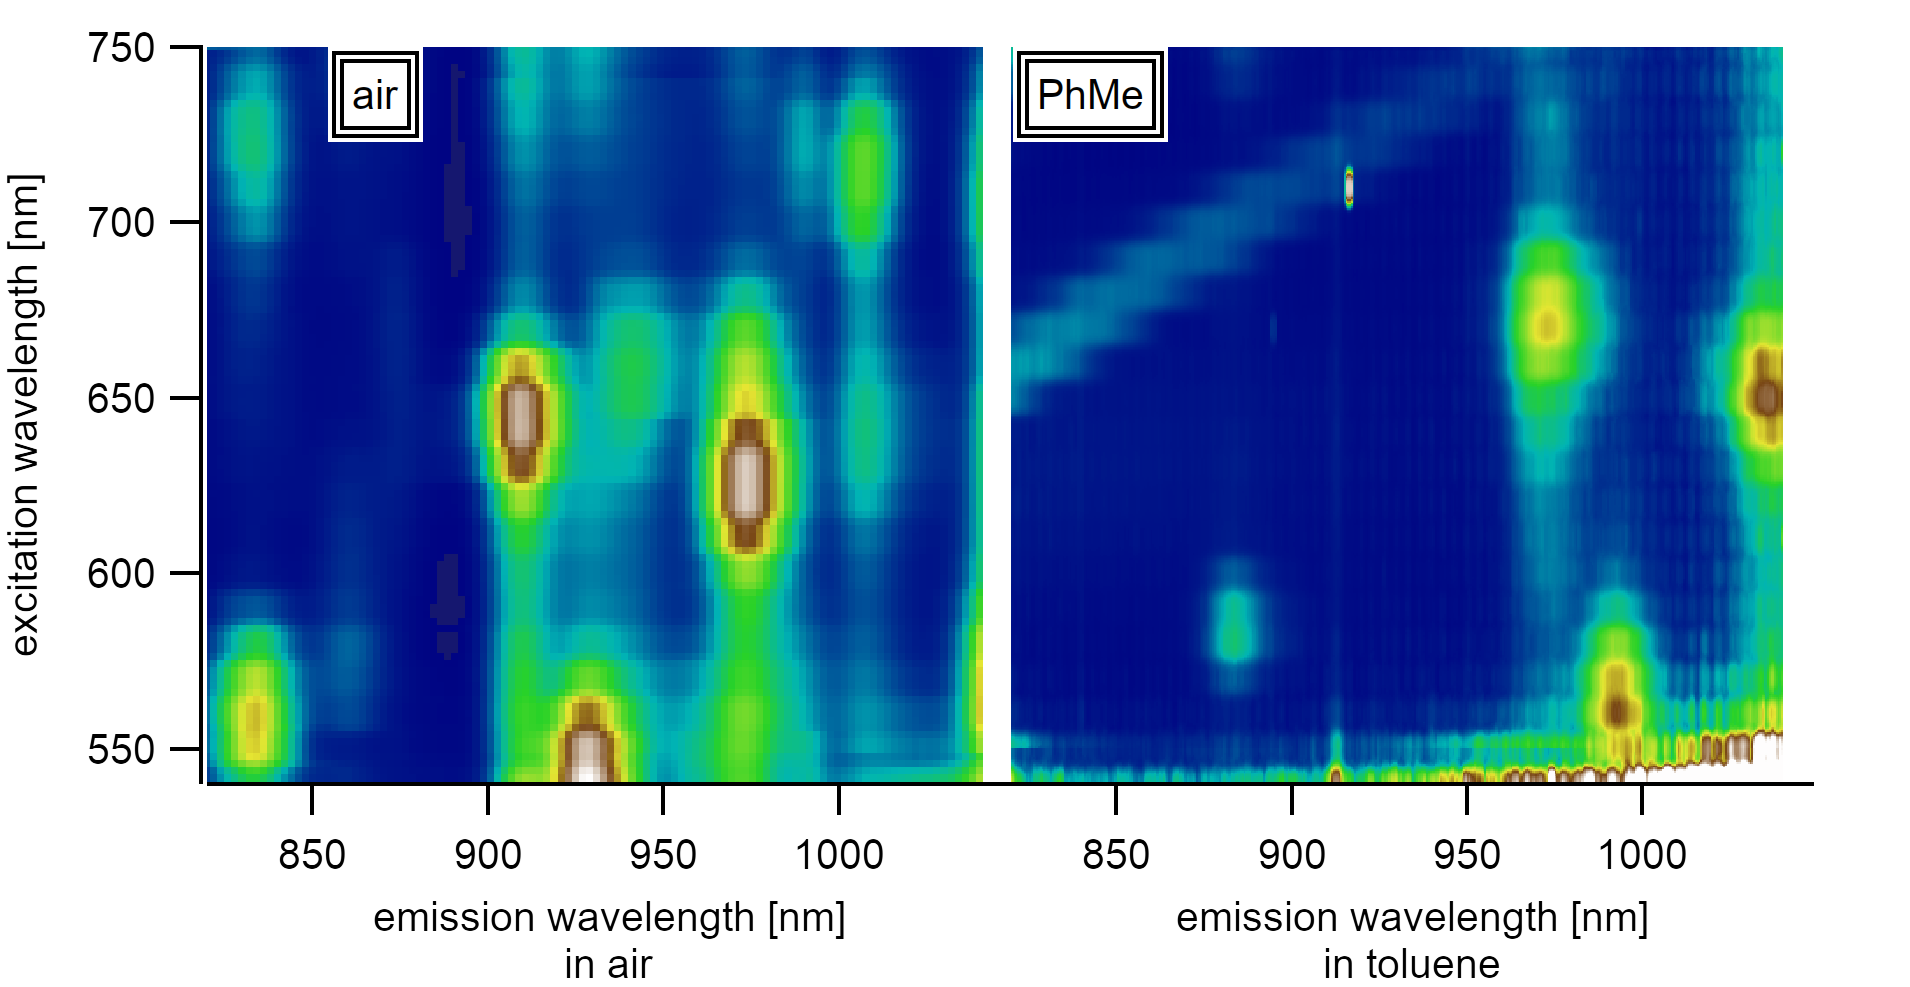
The excitonic emission in toluene shifts significantly compared to the emission of nanotubes in air. The graph shows the variance of single suspended nanotube spectra in air and in toluene.
The analysis is based on an investigation of full PLE maps of individually suspended carbon nanotubes. PLE maps have already been shown to be a good measure to determine the coverage of the surface with adatoms as they allow exact chiral assignment. It also allows shedding light on the diameter dependence and the exact shift caused by the dielectric environment of toluene between different chiralities.
Small Line Width
The direct comparison of air-suspended nanotubes to toluene-suspended nanotubes allows estimating the effects caused by the change in the dielectric environment from pure toluene without surfactant influences. The median line width in air is 15(1)meV (13nm). The inhomogeneous broadening in toluene causes a line width of 22(1)meV (18nm). Errors are given as the median average deviation (MAD). The transfer to toluene, thus gives a significant increase in the FWHM by 7meV.
The overall FWHM of the E₁₁ peak increases from 15meV (median) in air to 22meV (median) in toluene (left). This peak broadening is accompanied by a shift of 75meV to the red for both, E₁₁ and E₂₂ (middle). In toluene, the intensity drop drops to 15% (median) while the distribution maximum is more likely to be at around 5%. The distribution is shown as violin plot which is similar to a symmetrical histogram.
The full line width at half maximum (FWHM) in air is in agreement with the line widths of 12meV [127][139] of nanotubes individualized using surfactants and the range of 10-15meV reported for suspended nanotubes [212] at room temperature. Although, lower line widths of 8nm are reported for individualized nanotubes even at room temperature [156], the line width decreases during cooling [213], and reaches its homogeneous width of 1-0.2meV at cryogenic temperatures [212][214][13][215][17] because of exciton localization. The homogeneous linewidth is also known to broaden from electronic many-body effects like exciton-exciton annihilation (EEA) via Auger recombinations [214]. In this experiment, the excitation power was kept lower than 30µW (even in solution) as discussed previously to avoid such influences on the FWHM. Microscopy measurements on single surfactant wrapped nanotubes (attached to a surface) show line widths of 24meV in sodium dodecylbenzene sulfonate [139], and 13meV [216][217] for ssDNA/SDS wrapped nanotubes. However, a detailed investigation on the line width of single polymer-wrapped SWNT showed a widespread between 20-30meV (16-24nm) for an investigation on over 100 chiralities of the (6,5) type [218] which is typical for single-molecule microscopy. Although the experiments in this study were performed in a solvent, the line widths in pure toluene (22meV) are lower than the average value seen in the aforementioned study (26meV). This is expected as these samples suffer from defect inhomogeneously through mechanical processing, partly desorbed surfaces in air, stress/strain and dielectric effects from the surface attachment, and the widespread in length distribution, which by far exceeds the exciton diffusion length. Considering these effects, a comparison with surfactant wrapped nanotubes is nearly impossible. The investigation in this study is expected to be more accurate than any of the previous as the experiment design excludes all of the culprits as mentioned earlier and allows us to estimate the effect of purely attached solvent molecules.
High Intensity
A reduction of the emission intensity accompanies the described linewidth broadening. The emission after the transfer to toluene is reduced by 85% leaving only 15% of the initial emission. The spreading of the observed emission bleach is rather high and may depend on the varying defect concentration in the observed nanotubes resulting in a varying amount of additional exciton quenching sites. The wide intrinsic spread in intensity could also originate from varying reductions of the exciton lifetime caused by a varying solvent coverage. A comparison of the statistical intensity spread in air with the spread in a solvent was not performed as the results from such an analysis could be interpreted ambiguously.

The figure shows the shift of the excitonic transition energies to lower energies upon the transfer from air to toluene. The nanotubes in air are clearly assignable into two classes that experience two different dielectric surroundings.

Both states that experienced different dielectric surroundings in air shift to the same final energy in toluene.
The total energy shift for initially adsorbed molecules is lower than the energy shift for nanotubes with a clean surface and depends linearly on the diameter.
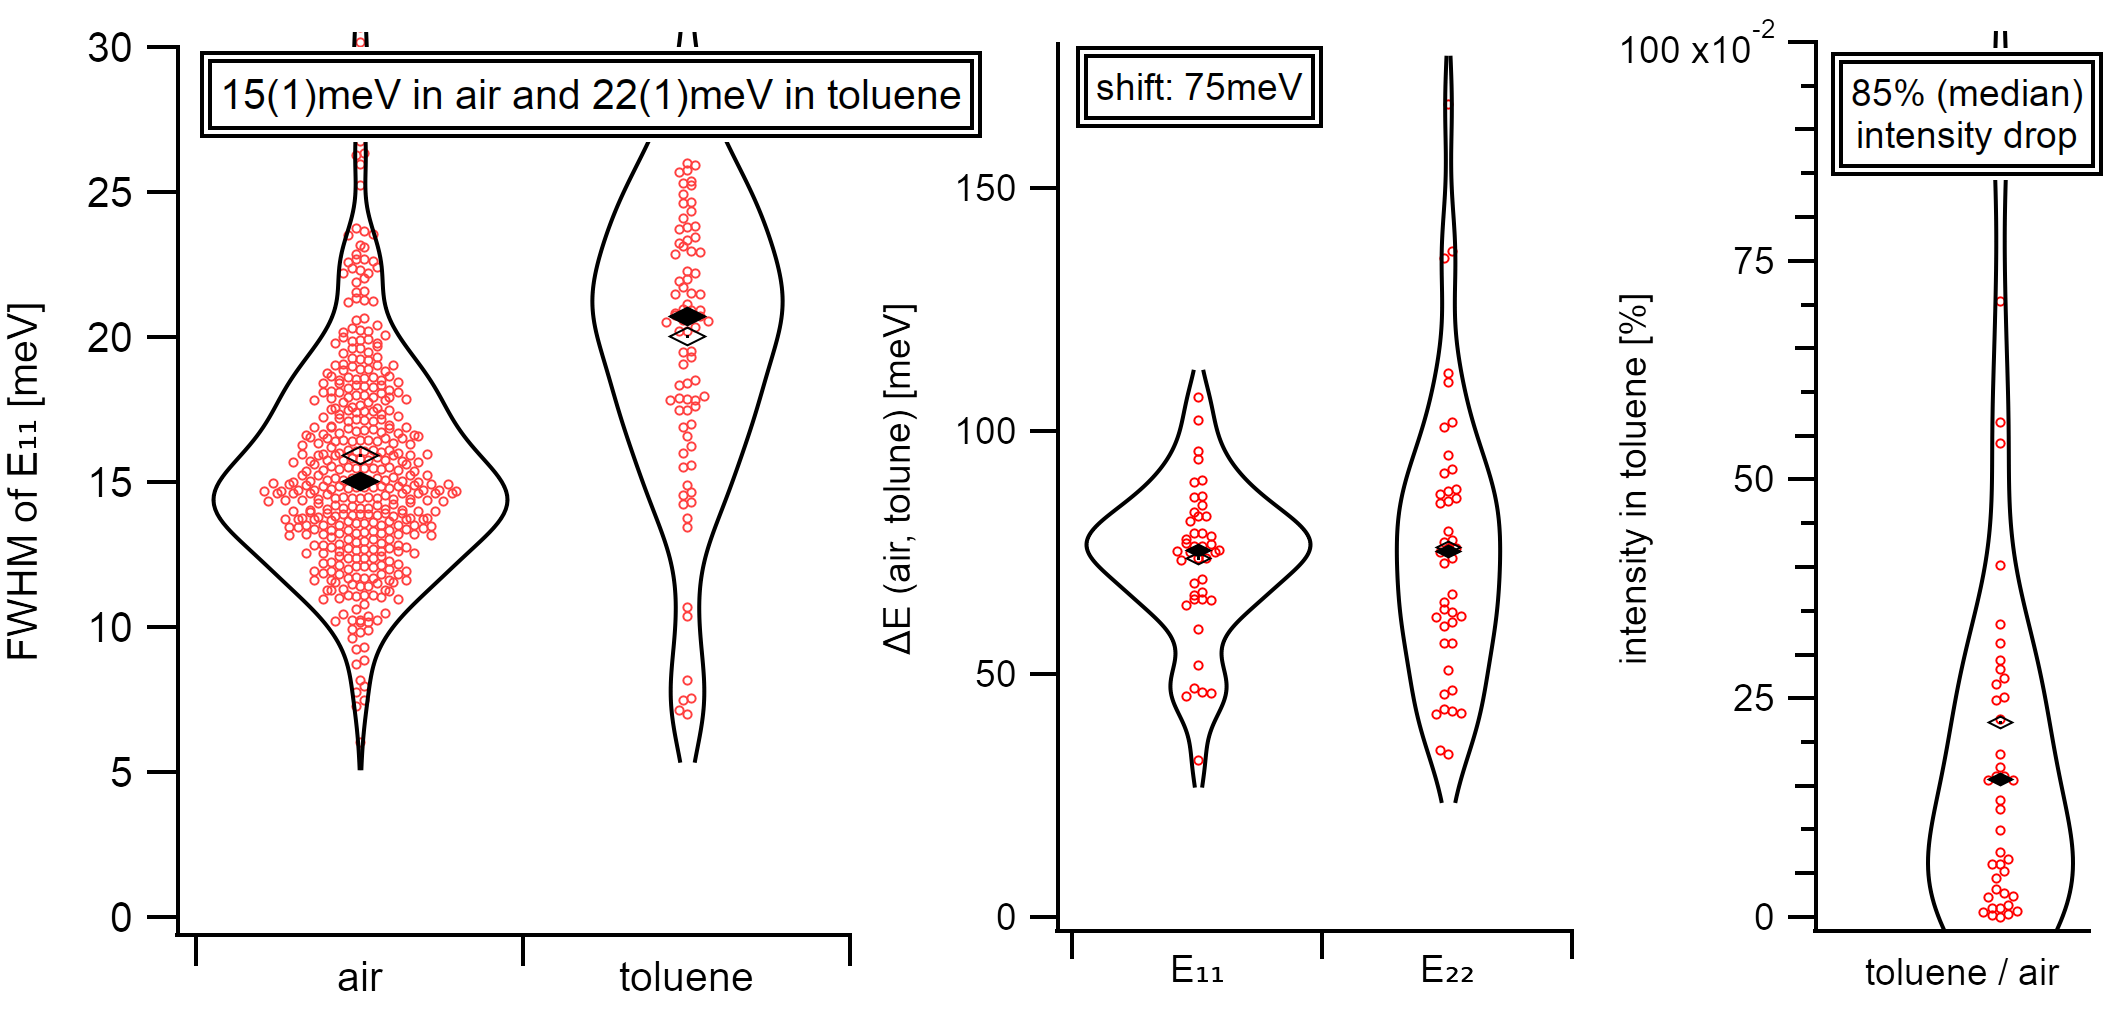
As shown before, nanotubes in toluene are more easily investigable than in other solvents like hexane, as they preserve the excellent emission properties of air-suspended nanotubes. The reason for the bright excitonic emission from carbon nanotubes in toluene might be related to the efficient coupling to the solvent phonon. The coupling comes from the Raman active CH stretching vibration and leads to an efficient luminescence down-conversion. It is tempting to assume that in the laser spot focus of carbon nanotubes in solution, the solvent phonon from toluene might be able to cause luminescence enhancements of the excitonic E₁₁ emission at least partly. Such observation is only possible if the nanotube is fixated during the recording of its emission as it usually quickly diffuses out of laser focus [219] during a recording.
Single PLE maps showing resonant energy transfer from the solvent phonon in toluene to the exciton in the first subband for the (6,4), (8,3), and (6,5) types.
Red-Shifted Energy
The transfer to toluene causes a peak shift of around 60-90meV to the red. The peak shift is lower by 50meV for chiralities that were initially adsorbed with a water layer. The emission of chiralities with an energy that was initially shifted to the red from an adsorbed water layer meets at the same excitonic energies than the nanotubes with an initially clean surface. This suggests that the water layer is completely desorbed in solvents and exchanged by a toluene layer. Although desorption of the water layer in toluene is entropically hindered, the gain in enthalpy from increased London interaction with toluene overcomes the desorption barrier of adsorbed water.
The excitonic states are formed at the π-orbitals of the carbon lattice. From a first estimate, the influence of the dielectric surrounding should, therefore, be equal. The measurement, however, shows a clear dependence on the diameter. Smaller diameters show more substantial shifts in their E₂₂ and E₁₁ energies. The E₂₂ absorption is widely broadened and has a higher error value. Nevertheless, the energy shift coerces with the corresponding E₁₁ emission levels. Since excitonic states on nanotubes with smaller diameters are likely to extend further into the dielectric medium, the excitonic emission is expected to have such a dependence on the diameter of the observed chiralities.
Conclusion
The measured dataset gives insight into pristine and unbundled carbon nanotubes without adsorbed surfactants other than the solvent itself. The measurement bridges a gap between suspended nanotubes and various unbundling processes in solution. It is especially crucial as dielectric effects on the outer surface originating from solvent and the process of bundling are usually impossible to differentiate as they are superimposed. The acquired data may serve as a reference for studying various other effects that influence the line width, intensity, or energy of excitons in carbon nanotubes.
label |
chirality |
excitation [nm] |
emission [nm] |
error (exc) [nm] |
error (emi) [nm] |
|---|---|---|---|---|---|
a |
(6,4) |
584.5 |
885 |
49.5 |
16.5 |
b |
(8,3) |
670.5 |
975 |
5 |
8.5 |
c |
(6,5) |
563.5 |
995 |
27.5 |
40 |
d |
(7,5) |
652 |
1035 |
3 |
7.5 |
e |
(10,2) |
750.5 |
1075.5 |
||
f |
(8,4) |
592.5 |
1123 |
9 |
12 |
g |
(7,6) |
653.5 |
1143 |
10.5 |
18 |
i |
(8,6) |
736.5 |
1190 |
12.5 |
7.5 |
k |
(8,7) |
746 |
1251 |
36.5 |
5 |
m |
(9,4) |
744 |
1126.5 |
11.5 |
8 |
Adsorption of Acetonitrile
Acetonitrile is a polar solvent with a dipole moment of nearly 4D [220]. It shows high solubility for charged molecules like tetrabutylammonium hexafluorophosphate and is, therefore, an ideal electrolyte for the exchange of charges. Molecular dynamics simulations are showing good solubility and fast diffusion characteristics for tetraethylammonium and tetrafluoroborate ions [221]. These are promising properties for various applications like supercapacitors or organic solar cells. As nanotubes can be electrically contacted [222], they can be used as electrodes where they exhibit a high active surface for high capacitance and faster ion diffusion velocities than typical activated carbon [223].
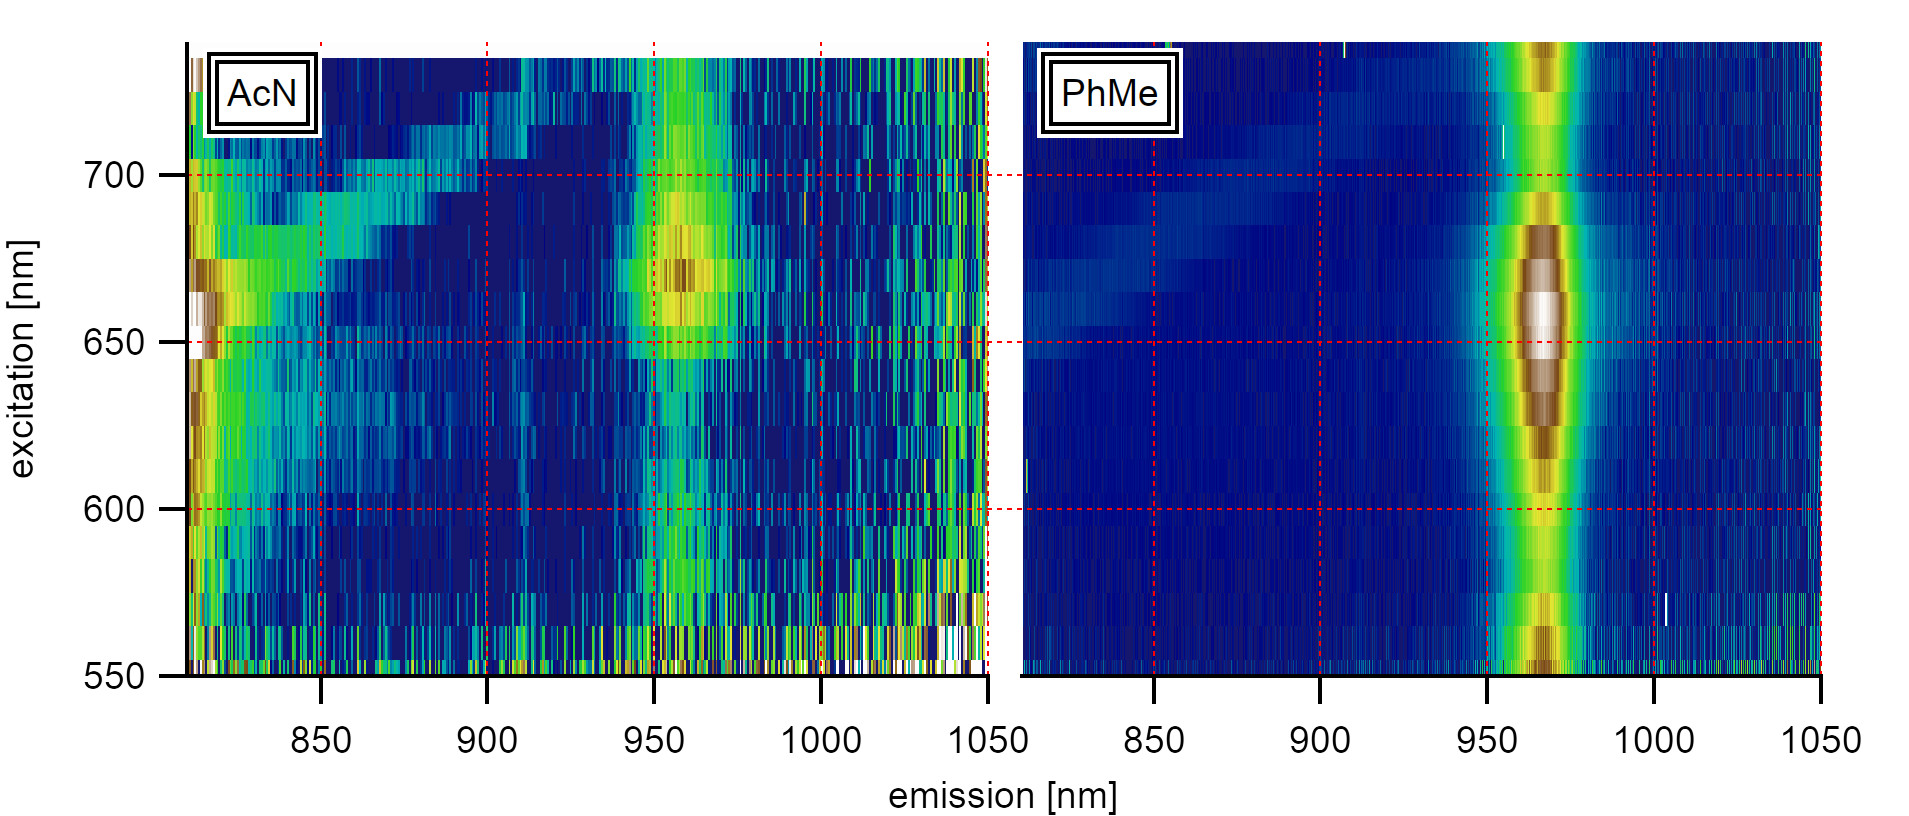
A comparison of the influence of the solvent phonon on the (8,3) type in acetonitrile and toluene shows the resonance of the Raman-active signal (diagonal) at 750nm excitation.
In order to test the behavior of nanotubes in acetonitrile, the vibration of the solvent can be used as a probe for solvent reorganization in the surrounding of the nanotubes. In a solvent like toluene or acetonitrile, the Raman active CH stretching mode (generated by the laser excitation) falls into resonance with the absorption of the nanotubes’ E₁₁ level for chiralities like the (6,4), (8,3), and (6,5) type. This resonance is nearly the same as observed in toluene. However, the different dielectric environment causes slightly different excitation/emission properties of the excitonic states.
Strong Emission
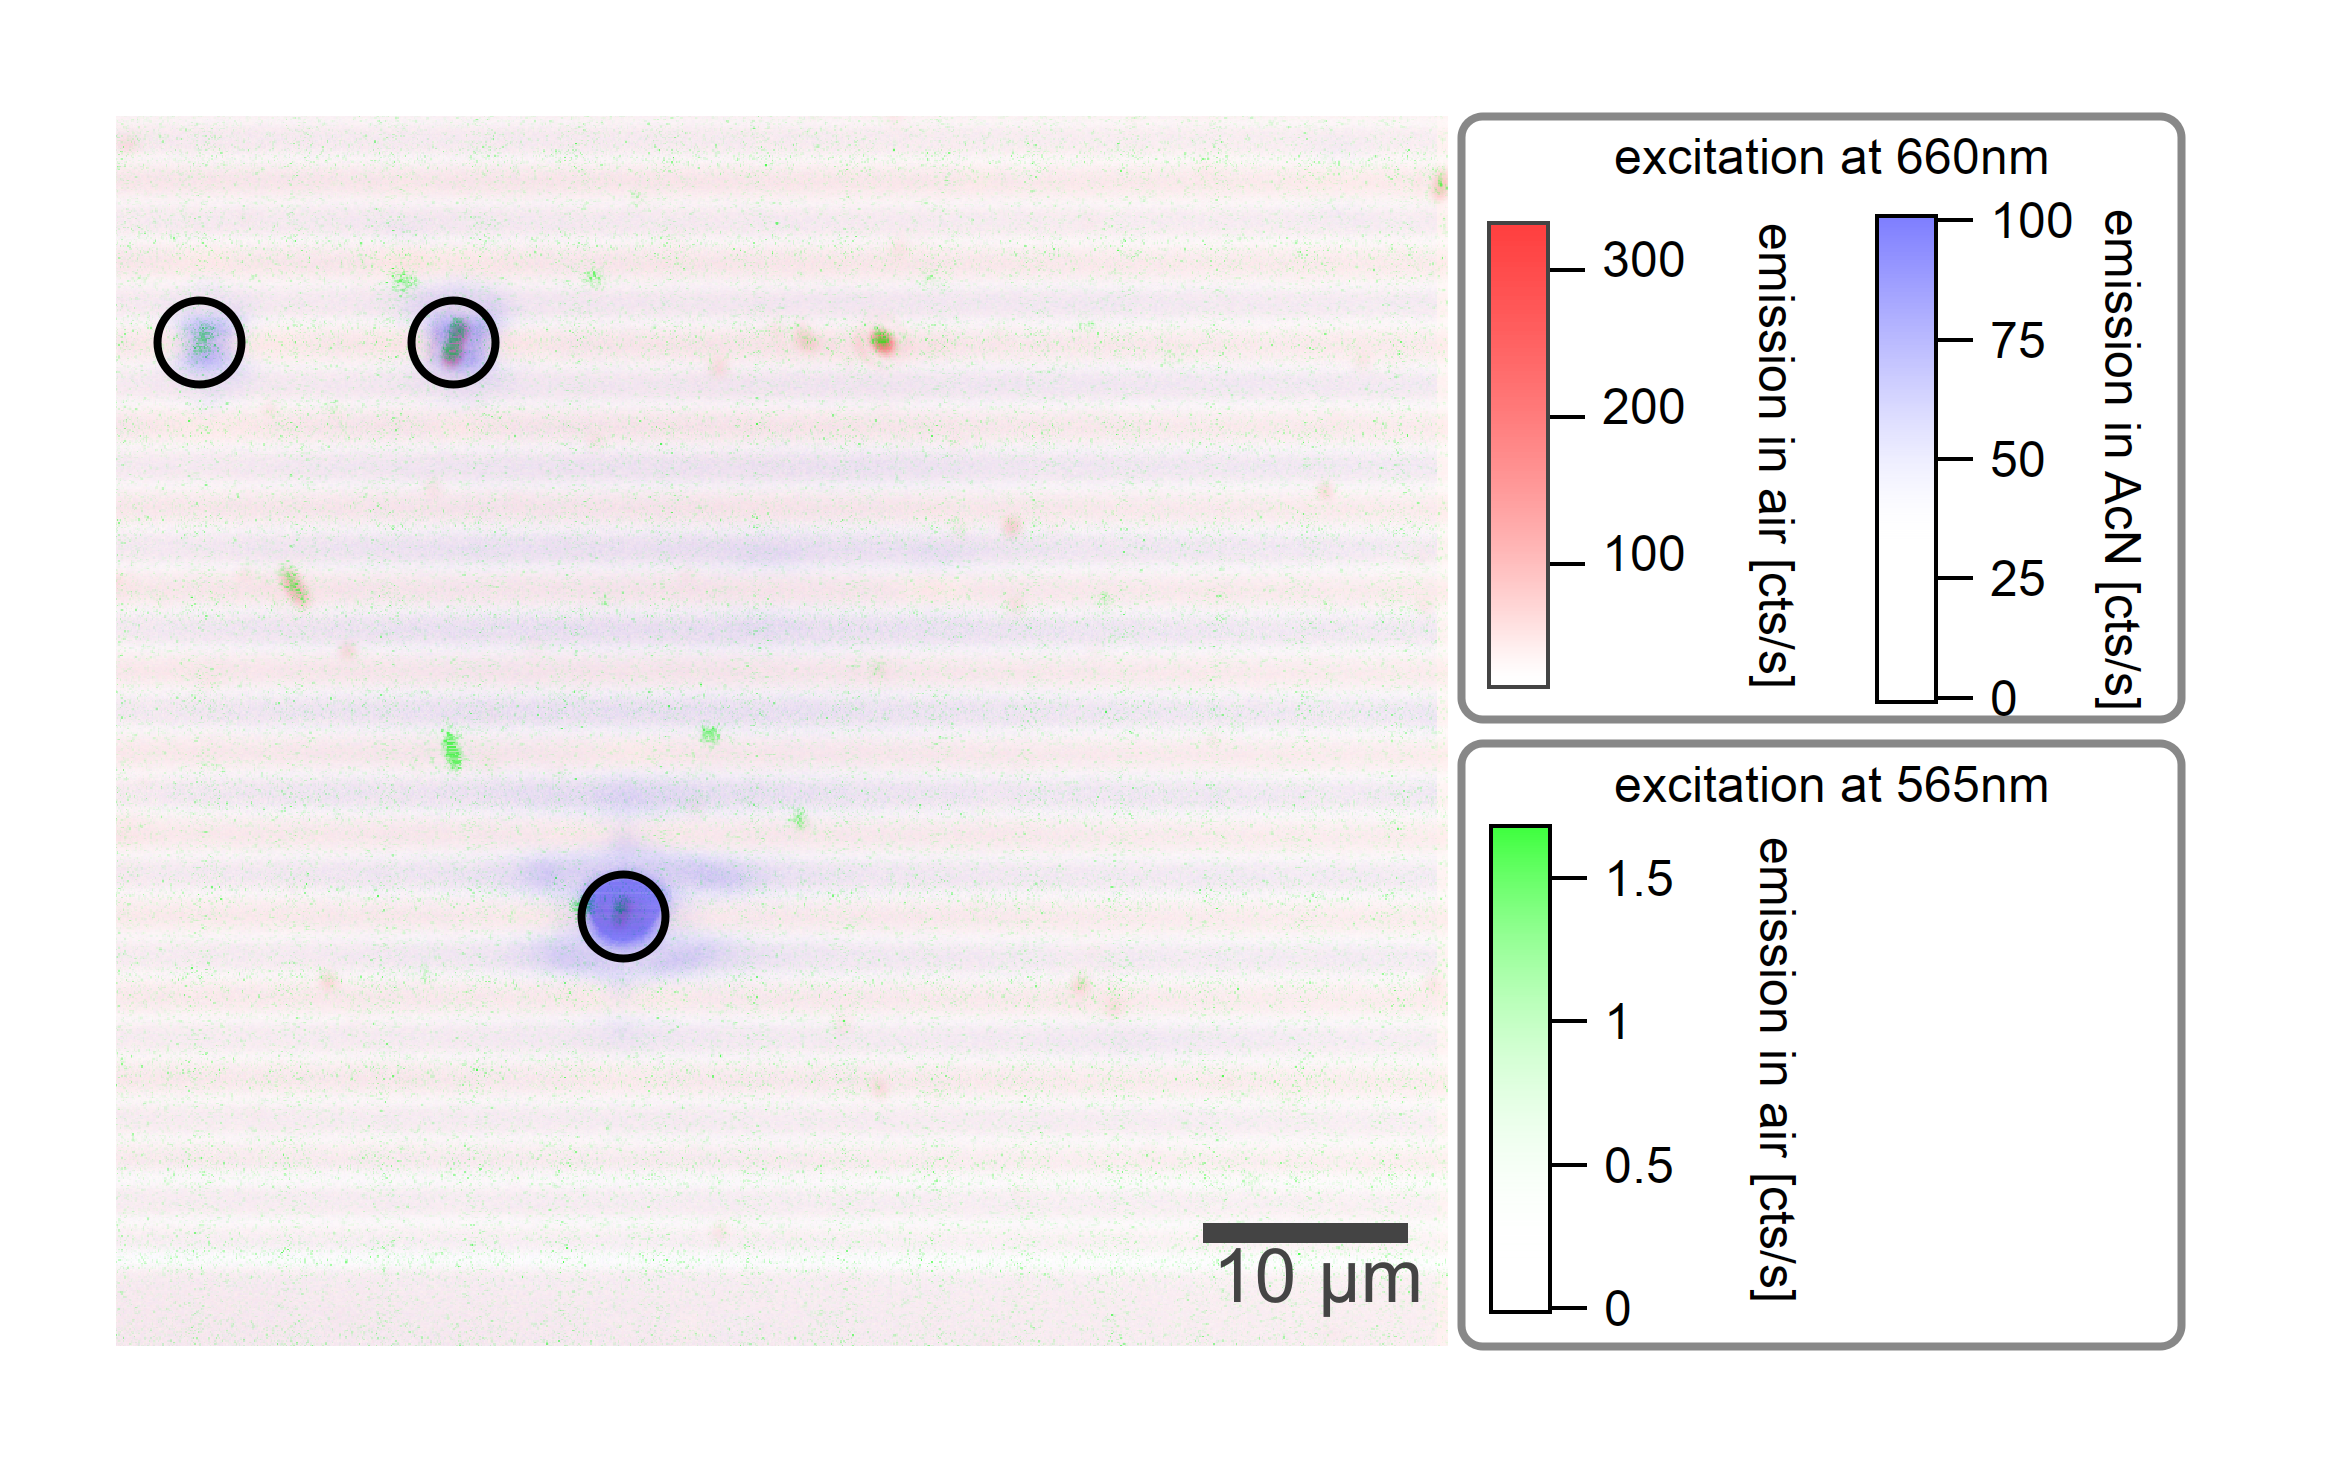
After one day in acetonitrile, enhanced emission at the locations of carbon nanotubes is visible. The emission in toluene is shown in blue while the emission in air is shown as an overlay in red and green.
If the sample is kept at room temperature for 24h, an emission emerges at locations on the sample where carbon nanotubes are located. The intensity of this emission is comparable to the emission of air-suspended carbon nanotubes and can be even brighter. However, it does not show similar properties of excitons in single-wall carbon nanotubes. Even though the sample preparation technique synthesizes at least 80% of the chiralities with a diameter larger than 0.8nm, the emission was only observed for the (6,4), (8,3), and (6,5) types which are a minority species in this sample. This suggests that this phenomenon has a dependence on the diameter of the nanotubes.
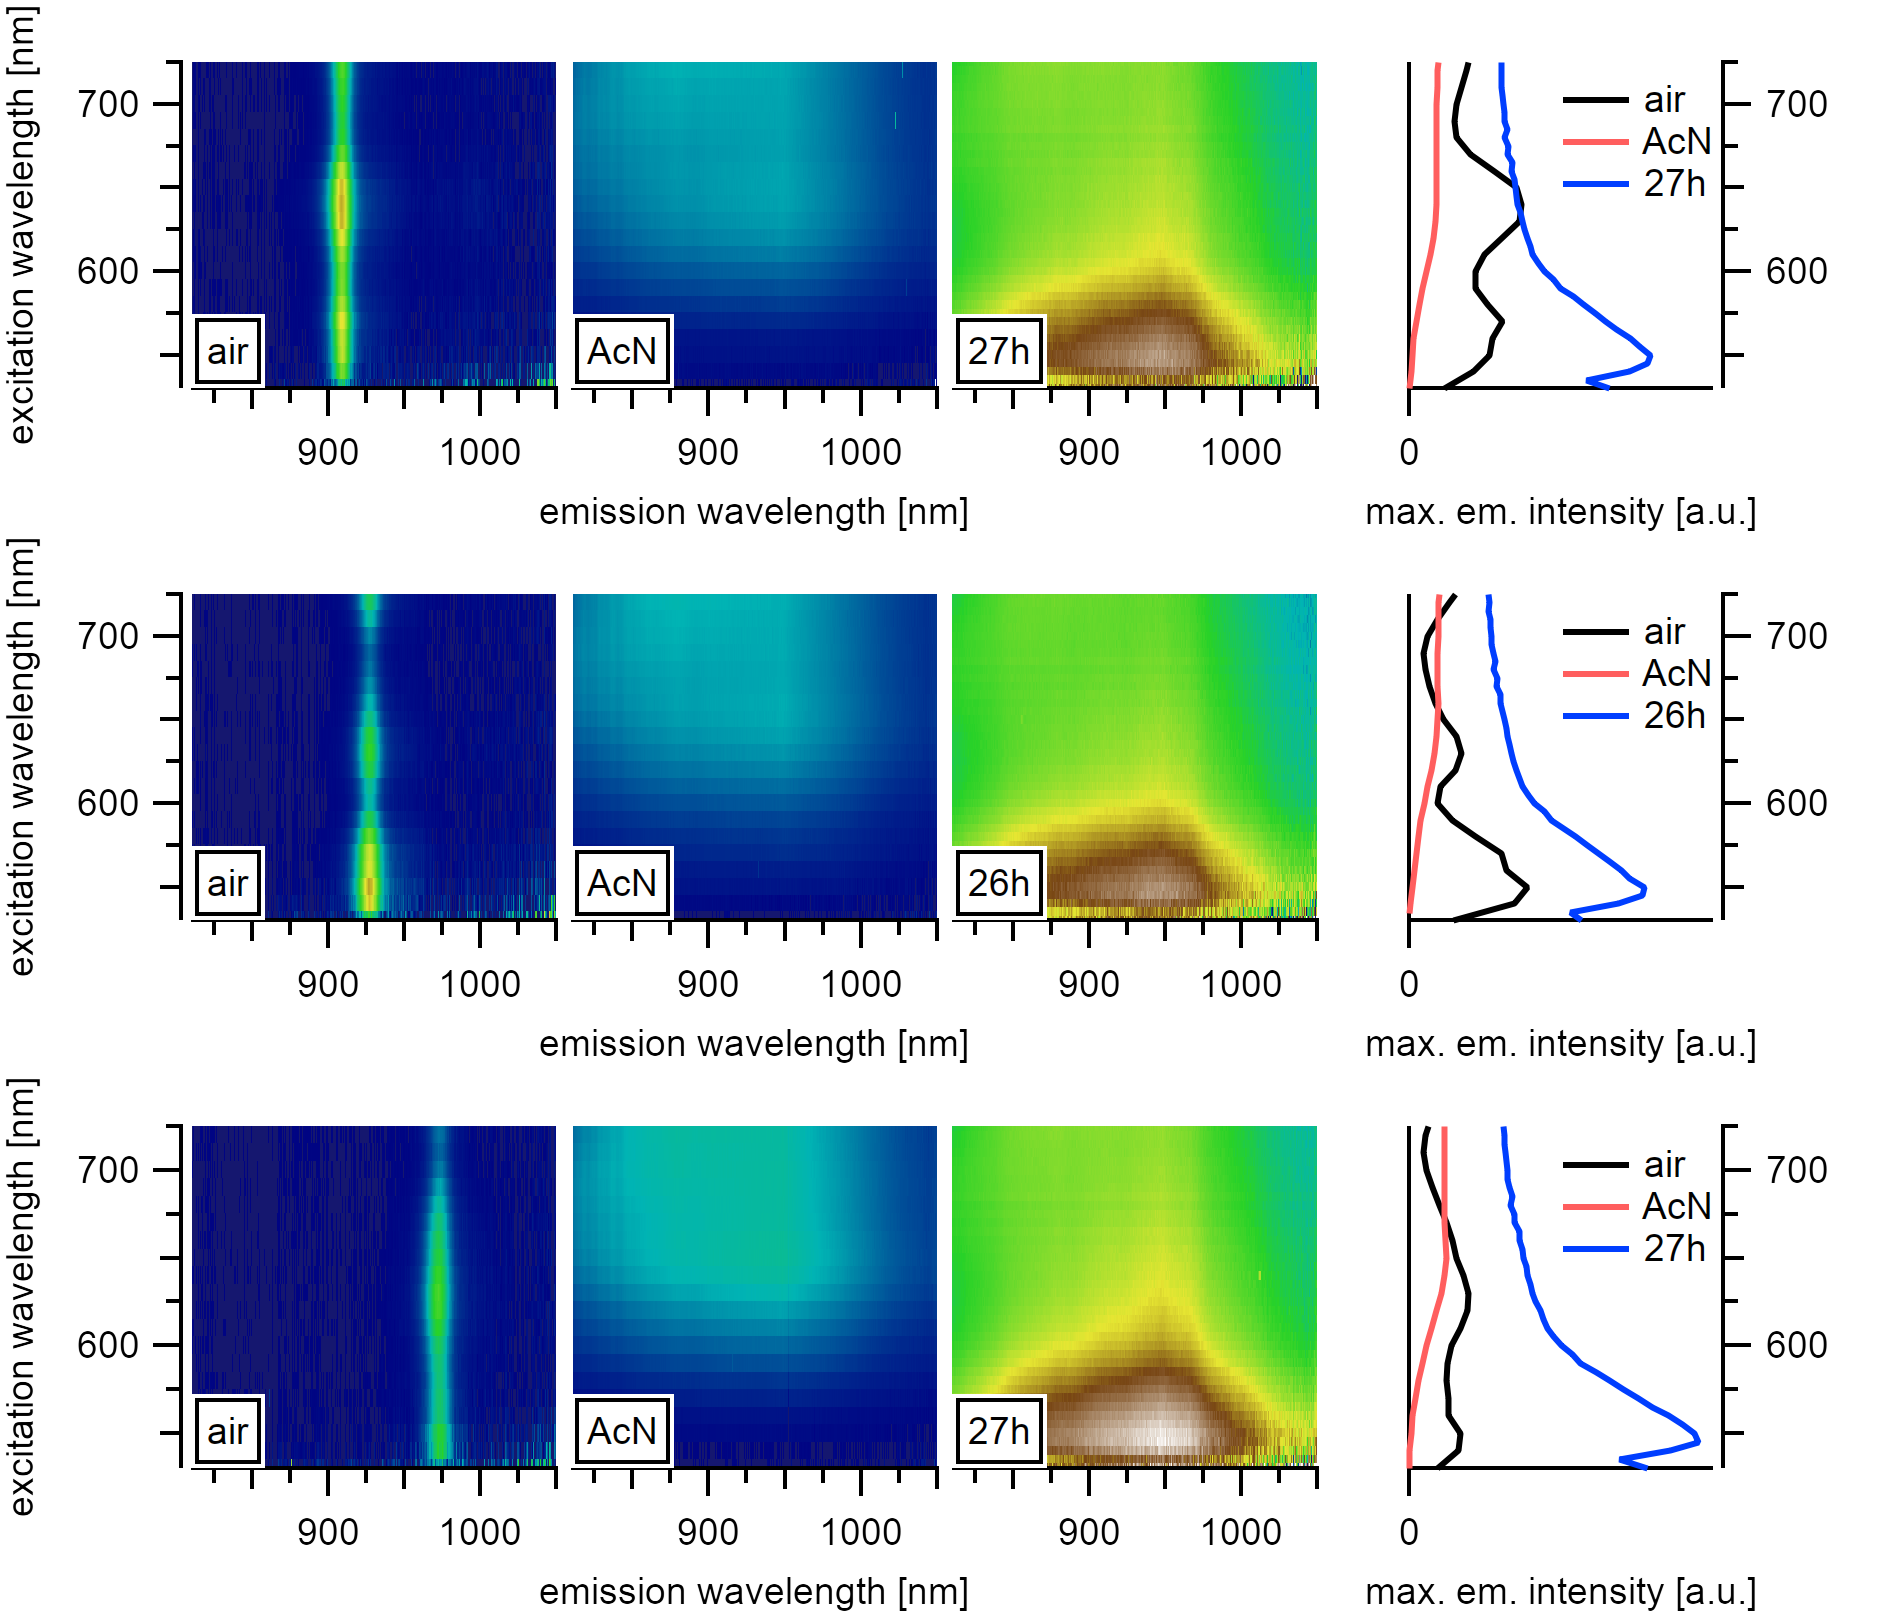
A strong emission emerges for the (6,4), (8,3), and (6,5) types. The emission after one day of observation is chirality independent.
The origin of the new signal is located at the spatial location of nanotubes. However, it is not originating directly from a typical excitonic state within the nanotubes as it is broad, shifted blue, and stays nearly the same within all observed chiralities. One similarity within the observed nanotubes is their absorption in air, which can be extracted from a vertical cut through the measured PLE maps. This profile strongly depends on the laser polarization.
Nanotube Vibrations
In the following, I will discuss the intrinsic properties of the investigated samples in air in more detail to get a better understanding of the polarisation dependence of the nanotube emission and the relation to the absorption spectrum as well as on vibrational couplings.
A cross-polarisation analysis of PLE spectra has previously found two resonances for transversal polarized excitation that are blue-shifted [224] to the central E₂₂ absorption. They are usually assigned to the E₁₂ and E₂₁ transitions. However, if depolarisation effect are considered the state is also sometimes assigned to an excited exciton state at higher coulomb energies [225].
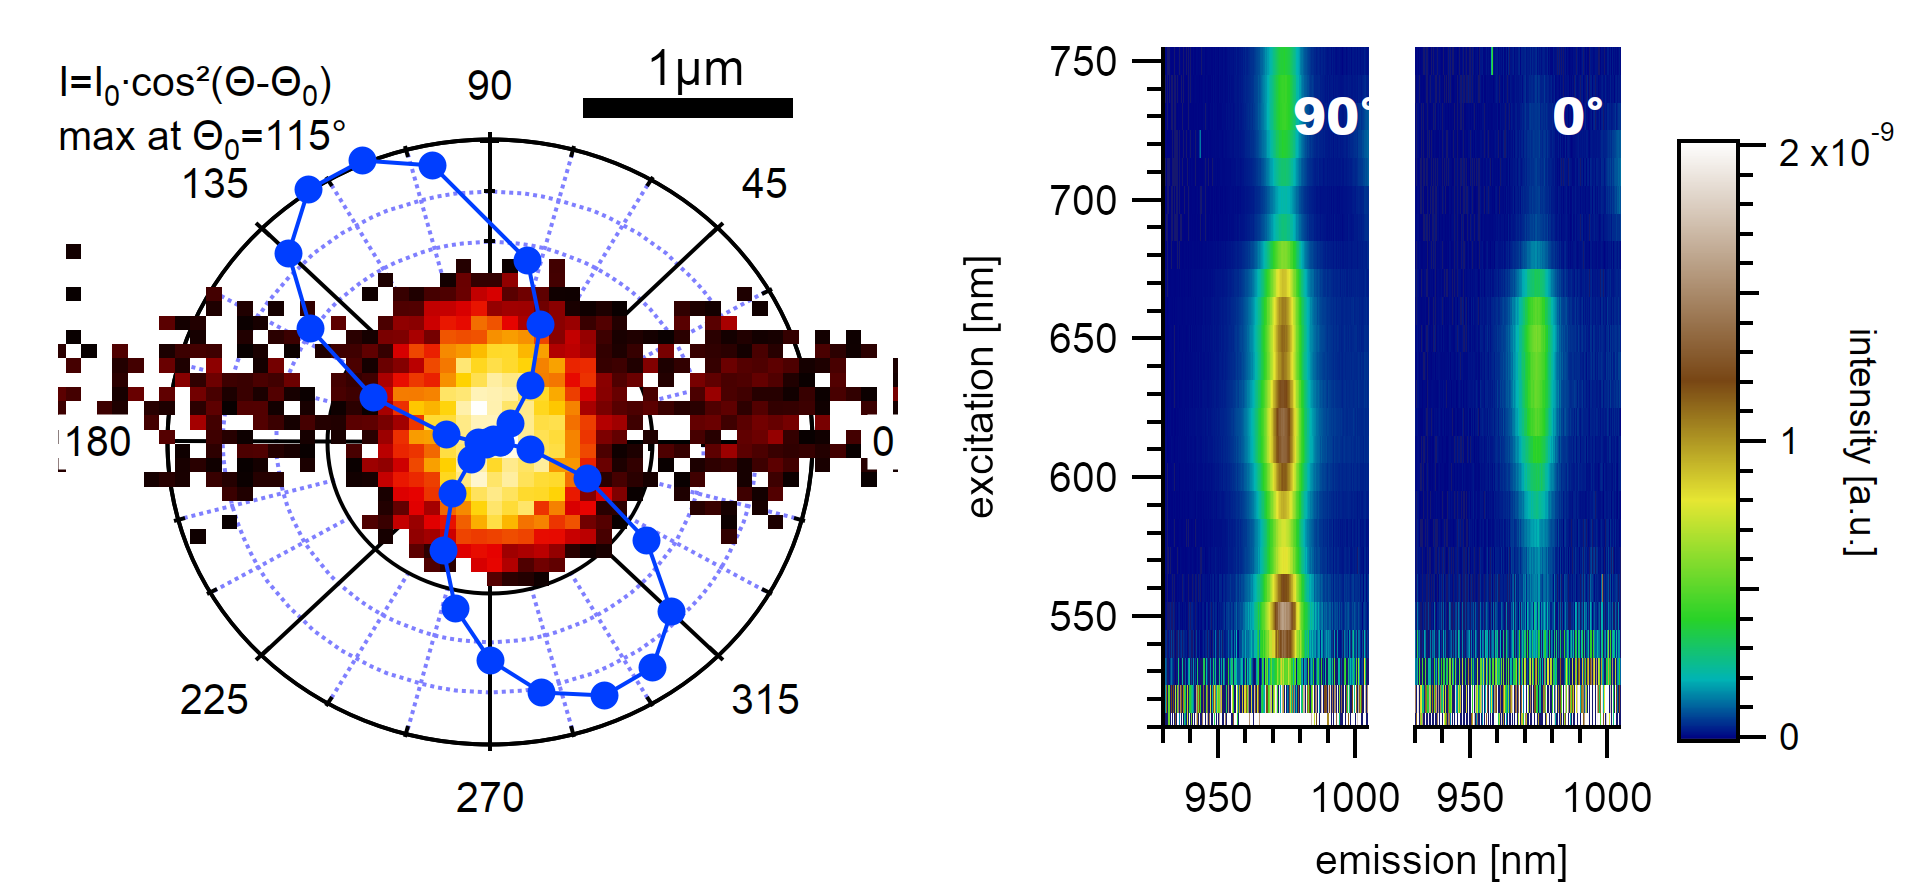
A (7,5) type in air with a clean surface shows a distinct dependence of its emission on the excitation polarization angle. The camera image at the recorded location is shown as an overlay image (left). In a PLE map, the modes above and below the second excitonic transition vanish at an excitation perpendicular to the nanotube axis.
The measured polarization intensity in the left graph is normalized to the power of the elliptically polarized laser, measured after the polarizer. The measured excitation intensity is altered by the formula depicted in the top left, which gives the best agreement if the nanotube is assumed to be suspended over the trench at an angle of 115° to the propagation of the trenches. The angle is found mathematically through optimization by assuming that a nanotube exhibits maximum emission intensity if it is excited along its longitudinal axis.
The absorption resonances in the recorded spectra are found to be polarized parallel to the E₂₂ resonance. This suggests that the resonances do not originate from E₁₂ transition but rather from a K-phonon assisted scattering process involving dark excitons [226].
band |
wavelength |
energy |
difference |
E₂₂+KPS |
550nm |
2.25(2)eV |
230(40)meV |
E₂₂ |
615nm |
2.02(2)eV |
|
E₂₂-KPS |
650nm |
1.91(2)eV |
110(40)meV |
E₂₂-2D |
735nm |
1.67(2)eV |
350(40)meV |
E₁₁ |
974nm |
1.273(1)eV |
The lower energy phonon depends on the dielectric electric environment [227], this explains the lower energy of 110meV for ε=2 (vacuum) compared to the typically seen 140meV [216] at ε=4 for the lower and 200meV for the higher phonon scattering process. Similar to Torrens et al., the sum of the splitting matches with the 2D mode at 326meV [216] as the transversal KPS mode is also responsible for the 2D mode.
The energy of the K-phonon was calculated to be at 170meV above the bright Γ-momentum excitonic state [227]. This allows calculating the binding energy of the dark exciton for a suspended (7,5) type to 60meV which is almost double the value compared to usual reports in solution.[200][228][216] but in good agreement to other reports in vacuum [184][229]. The fraction of the spectral weight that is transferred to the phonon sideband was estimated to increase significantly for smaller diameters like the 0.8nm of the (7,5) type. [227] The measured spectral weight of these absorptions bands is higher than in typical samples, which underlines the high phonon binding energies but does, however, not fully explain its origin. The formation of sp³-defect from nitrogen poisoned catalysts or from the remaining ethanol after synthesis during the rapid cooldown similar to hydrogen defects in the reaction chamber is possible but could not be affirmed. To the best of my knowledge, these phonon sideband absorptions near the E₂₂ level have never been reported. Neglecting its unclear origin, the excurse into the phonon sidebands of the investigated nanotubes showed that the samples have excellent coupling to the optically active K-phonon vibrations. In the following, I will show that such coupling might be necessary to get increased resonance transfer from solvent phonons to the nanotube.
Solvent Vibrations
In the previous analysis, I have justified that the investigated nanotubes show phononic vibrations with high binding strength in their optical absorption. Other than in air, however, in acetonitrile, the maximum of the spectral emission intensity changes only by 5-10% if the excitation polarisation is rotated by 90°. This is different from the emission of typical carbon nanotubes and suggests that the emission in acetonitrile happens via an initial excitation into a depolarizing state. As the emission signal does not originate directly from excitons on the nanotubes, the solvent is suspected to be the origin of this depolarization effect. The vibrations are further analyzed to understand the possible effects of the solvent.
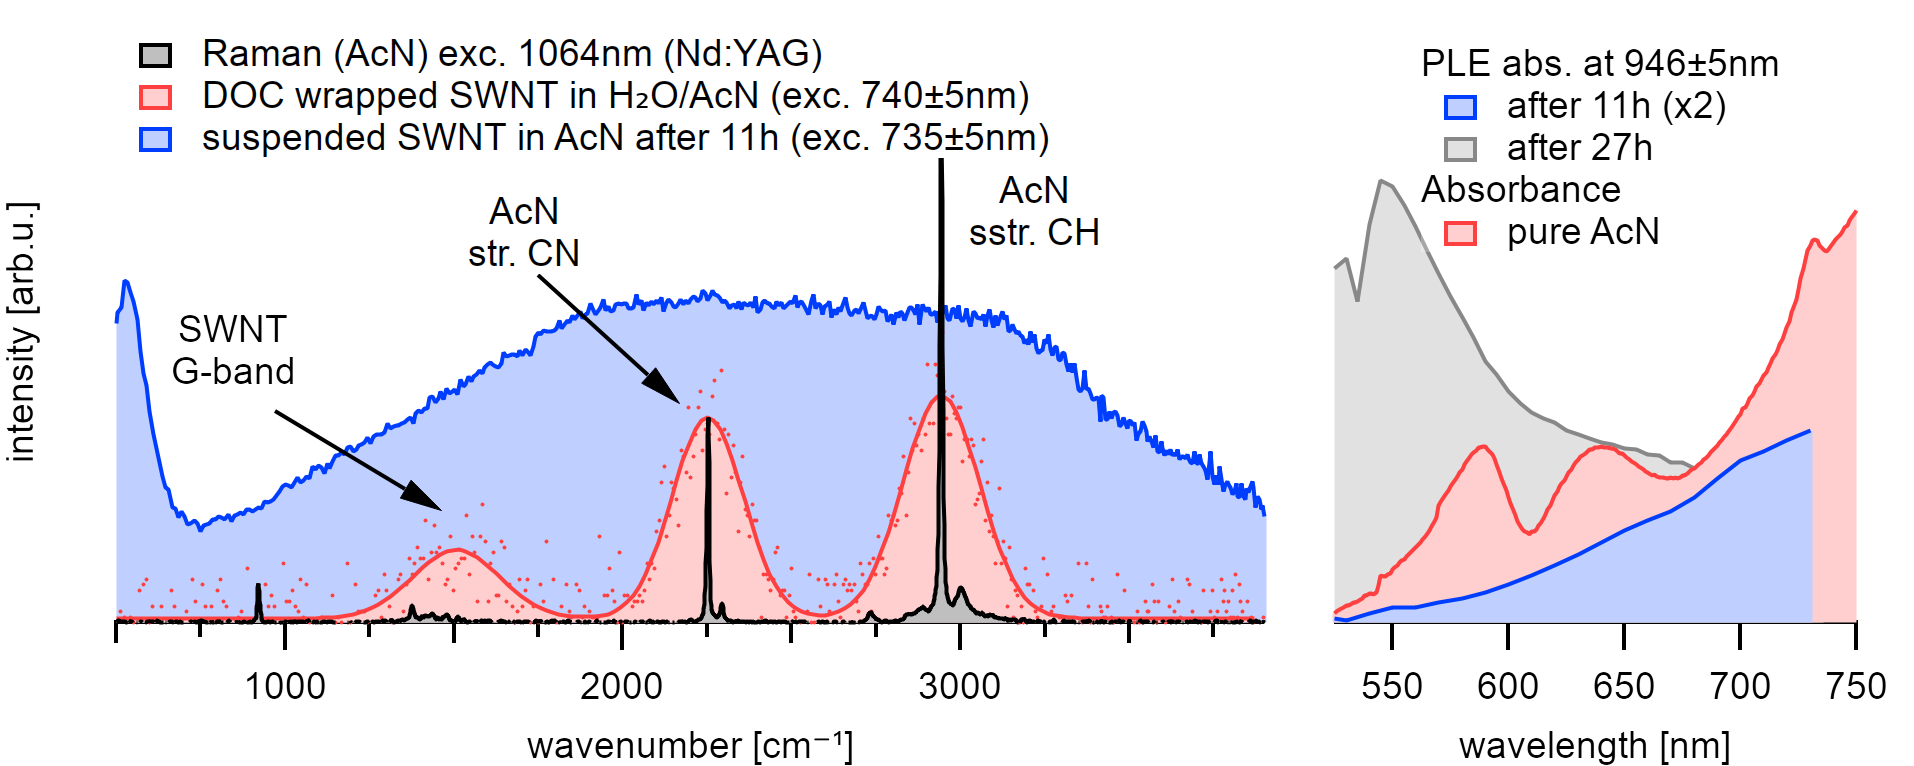
The emission at an excitation wavelength of 735nm shows good agreement with the three phonon modes that are present in this system.
A comparison with the optical absorbance of the solvent shows that the PLE absorption is enhanced at similar wavelengths where the solvent absorption shows resonances.
Acetonitrile is a linear, polar molecule of  symmetry.
The stretching of the CH bond at 2942cm⁻¹ and the CN bond at 2250cm⁻¹ are both
strong,[230][231] optically active infrared and Raman
vibrations. Acetonitrile shows a good absorption to the 5th overtone at 625nm
and moderate absorption to the 6th overtones of the CH stretching vibration at
540nm.[232] The 4th overtone of the CH stretching and the 5th
overtone of the CN stretching vibration are located at the rising absorption at
around 735nm.
symmetry.
The stretching of the CH bond at 2942cm⁻¹ and the CN bond at 2250cm⁻¹ are both
strong,[230][231] optically active infrared and Raman
vibrations. Acetonitrile shows a good absorption to the 5th overtone at 625nm
and moderate absorption to the 6th overtones of the CH stretching vibration at
540nm.[232] The 4th overtone of the CH stretching and the 5th
overtone of the CN stretching vibration are located at the rising absorption at
around 735nm.
After placing the sample in acetonitrile, the excitonic emission from nanotubes can be recorded similar to the emission in toluene. The solvent phonon from excitation to the virtual laser niveau is visible as two parallel diagonal lines in the PLE maps that are broadened from the intrinsically broad laser excitation profile of our white light source. A comparison with the emission in pure acetonitrile using 1064nm excitation of an Nd:YAG Laser and calculations using B3LYP confirms the vibrational origin.
After 11h, however, the observed emission intensifies towards the 4th and 5th CH stretching overtone resonances at 625(25)nm and 735(10)nm, and the PLE absorption becomes comparable to the absorbance of pure acetonitrile. The spectral weight of the emission follows the location of the two strongest Raman active stretching vibrations of the solvent molecules at 946nm and 888nm at 735nm resonance. Even though the excitation with our white light source broadens the emission signal, it also typically gives clearly differentiable peaks. In contrast, the observed solvent phonons around the nanotube are broadened compared to the liquid around. Moreover, the intensity is significantly higher at the location of the nanotubes than in the solvent surrounding.
After 26h, the spectral intensity even exceeds the emission properties of the nanotubes in air. The absorption resonance intensifies at the location of the 6th overtone of the CH stretching at 545(5)nm while the emission maximum at 946(2)nm intensifies for all observed chiralities.
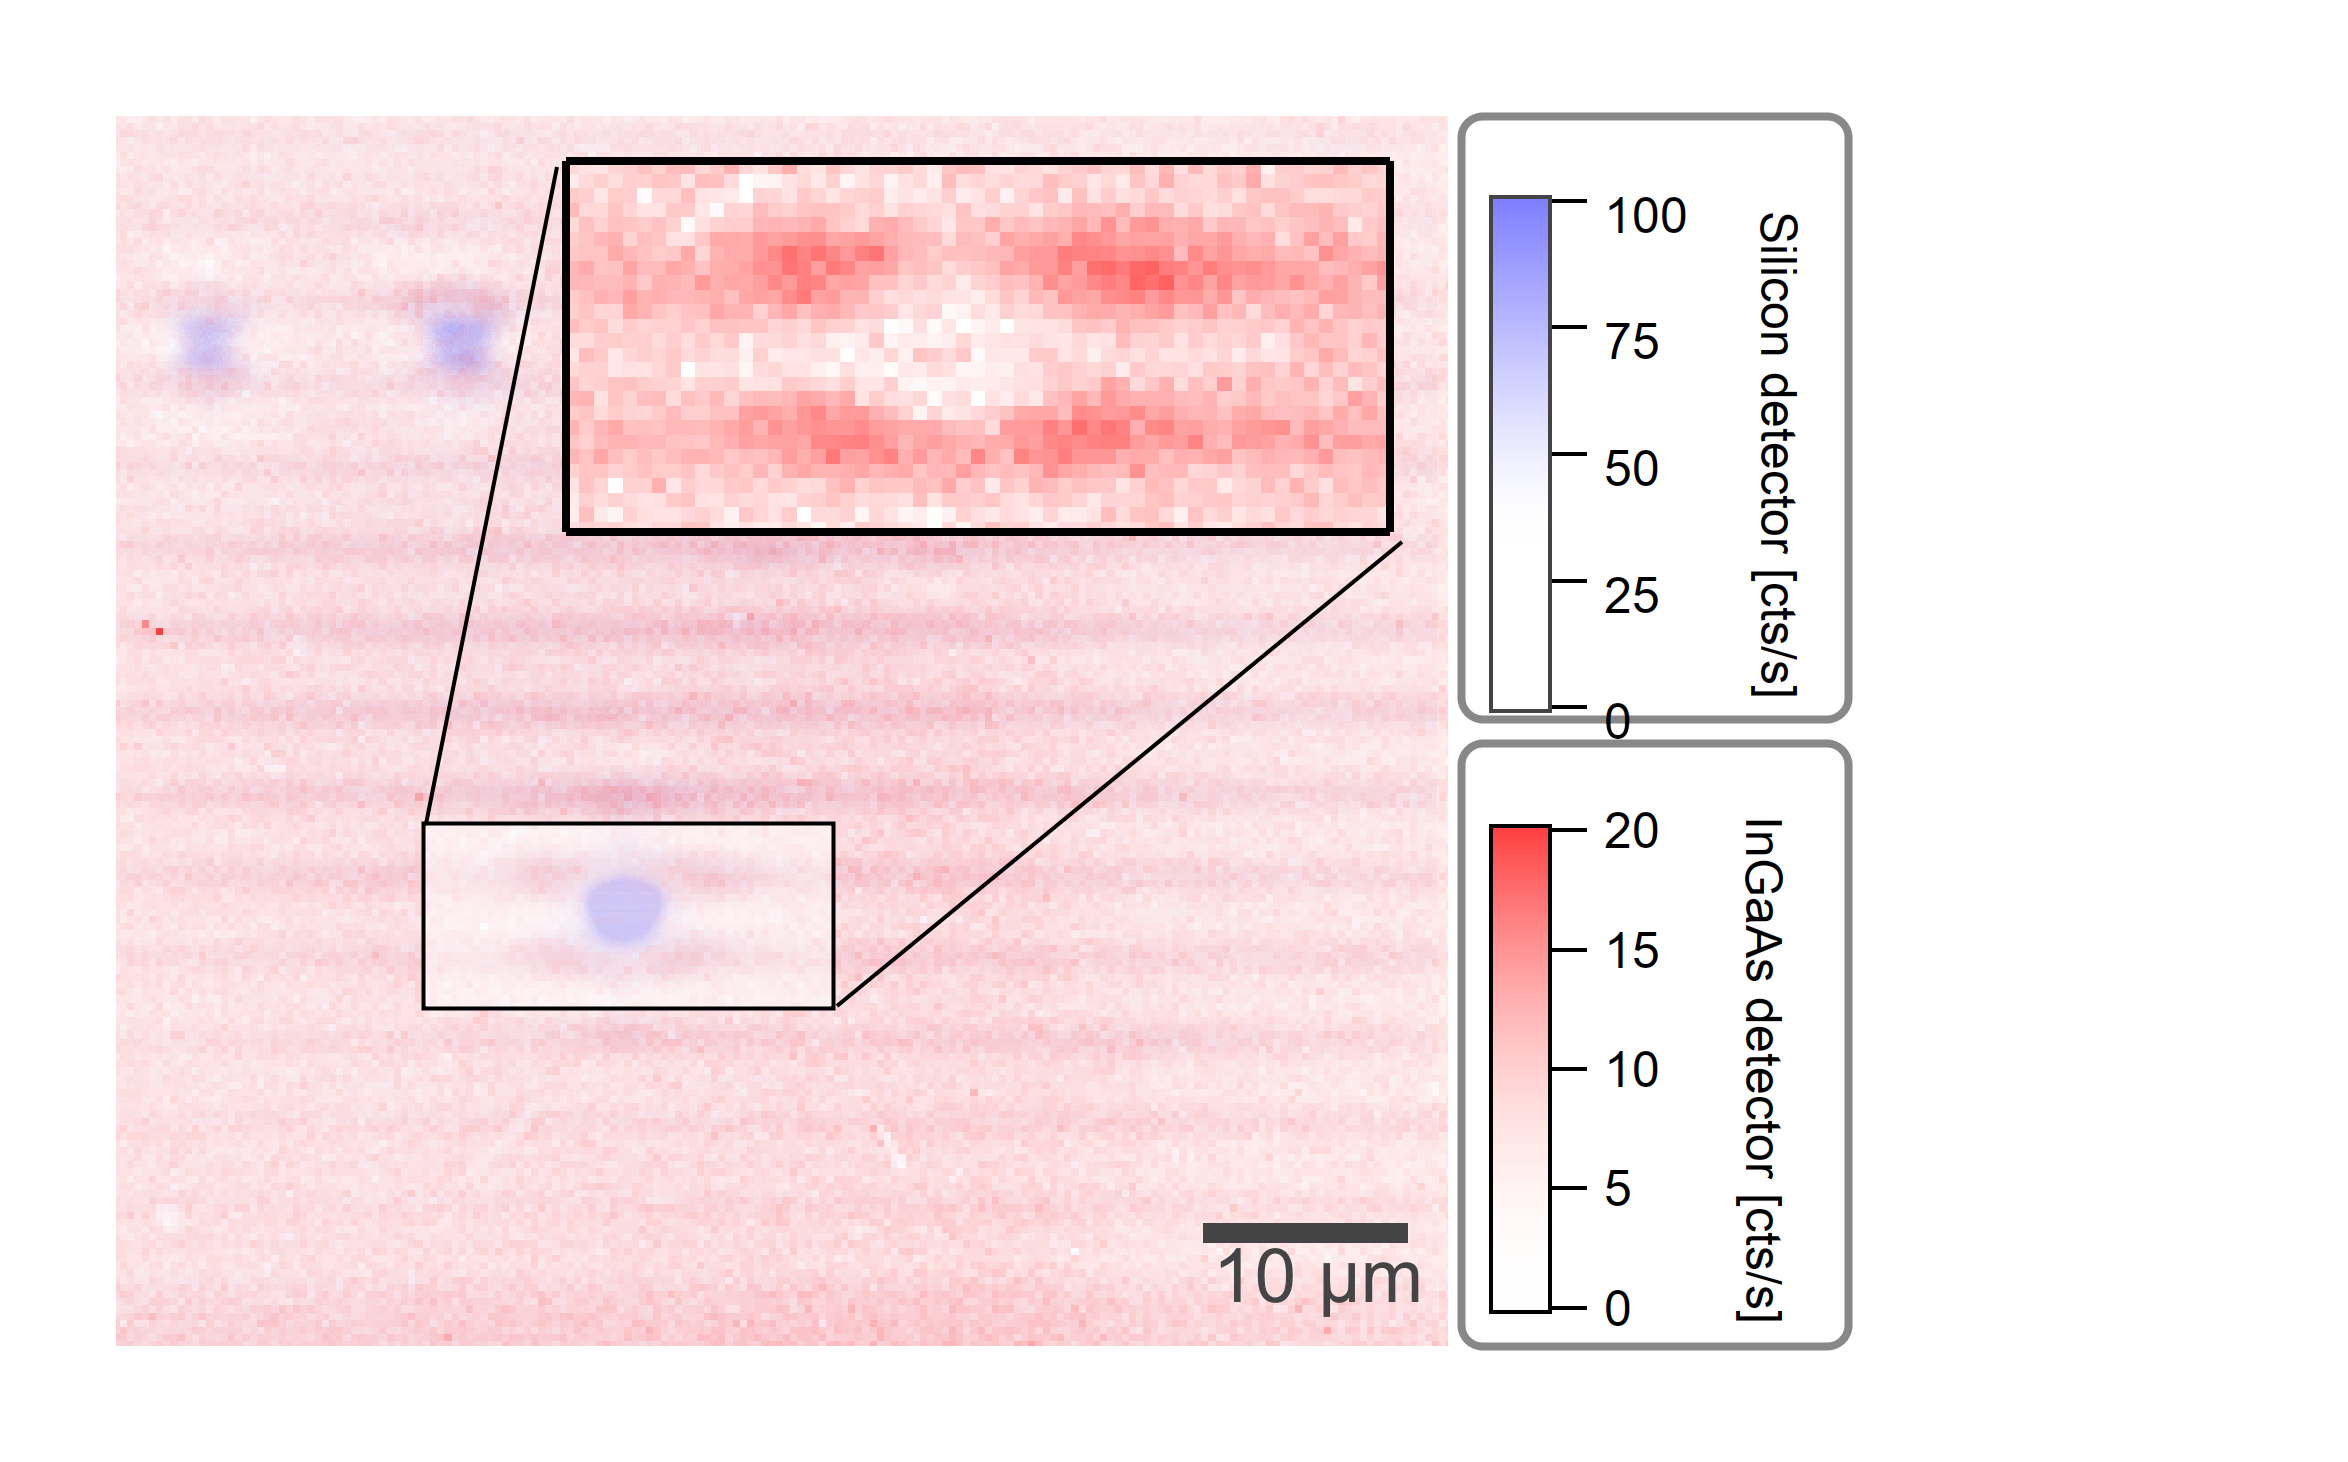
The emission (0.85µm - 0.9µm) is centered at the location of the nanotubes, while the SWIR emission (>0.9µm) originates from the spacial surrounding of the nanotubes.
Cyanide Nanotubes
Due to its cylindrical shape, carbon nanotubes have two different surfaces: An inner and an outer surface. The outer surface is highly accessible for fast molecular adsorption and desorption processes. In contrast, the inner surface is only reachable through the two ends of the tube, which limits the speed of molecular diffusion.
A (6,6) chirality has only an accessible inner diameter of 0.48nm for solvent molecules to enter [233]. Therefore, only small molecules like water [234][235][236][237][100], acetonitrile [233], or fullerenes [238] of a suitable diameter are able to enter the inside of typical carbon nanotubes. This encapsulation technique is known as nanofluidics and useful i.e., for confining the dipole moment of dyes in a linear chain inside the nanotubes which enhances the dyes’ absorption and emission characteristics.[239]
In solution, acetonitrile forms cyclic dimers with antiparallel orientations while collinear dimer formation is usually considered to be insignificantly low.[231] Collinear dimers, however, show substantial Mulliken charge differences between the two carbon atoms in both, the donor (head) and the acceptor (tail) molecule [240] of the dimer configuration. The charge is reduced on the methylic donor carbon atom and increased at the nitrile carbon, which increases the net charge distribution of the dimer configuration by around 0.5e.
There have been predictions for the symmetric arrangement of acetonitrile inside and around carbon nanotubes: As acetonitrile is a linear molecule, inside of nanotubes with smaller diameters acetonitrile arranges in a uniform lateral head-to-tail pattern [10] whereas concentric structures form as the diameter increases [233]. Such a uniform arrangement can intensify the initial dipole moment by strong resonant coupling of the longitudinal stretching vibrations.
The evolution of this calculated uniform arrangement is expected to be limited by the diffusion speed through the ends of the nanotubes, which explains the slow time evolution of the observed luminescence. The infrared active higher modes of the solvent vibration are excited, depolarize the signal, and carbon nanotubes of the observed chiralities can resonantly couple to these vibrations. Strong coupling of the K-phonon sidebands with the bright exciton assists in an efficient excitation energy down-conversion to the stretching phonon resonances. From these modes, the vibration relaxes radiatively. The high structural confinement of the molecules in such a vibration causes a damped oscillation, which explains the observed broad line widths. Spatially resolved camera images of this emission suggest that there is also significant solvent interaction on the outer surface of the carbon nanotubes. Supercapacitors rely on the adsorption of molecules on an electrode surface and lossless conduction contact from this surface to an electrical circuit [221]. Due to their high dispersion interaction and binder-free adherent contact to the electric potential, carbon nanotubes are highly favored for this application [223]. Due to its assumed polarity, the discovered system should be suitable for efficient ion adsorption. It is notable, however, that polarized carbon nanotubes generally suffer from bundling in organic solvents [210], which is an expected major culprit. Indeed, so far, it was not possible to isolate these nanotubes in solution using established recipes. An adapted recipe should start by solvating the centrifugation residue after sonication and analyzing the outcome via density gradient centrifugation.
Conclusion
The low quantum efficiency of carbon nanotubes is their most prominent culprit and hinders their usage in photonic devices. The investigated system shows efficient energy down-conversion from 540nm to 950nm, which by far exceeds typical values of even air-suspended nanotubes. Nanofluidics is an emerging field that has shown to give astonishing improvements to the emission properties of individual nanotubes. Couplings of the E₂₂-exciton can explain the down-conversion in acetonitrile to the solvent phonon stretching vibrations. Its significant enhancement over longer observation time scales allows suggesting solvent diffusion through the ends of the nanotubes. Such down-conversion could be useful for experiments in biological tissues [15] where blood and water absorption opens a window in the SWIR between 700-1300nm [11] which enhances the contrast ratio for nanotube-based fluorescence sensors. It should also be possible to harvest the electrons of the transitional excitonic states in the photoactive layer of bulk heterojunctions.